
19.1 How to Plot a Quadratic Graph Using a Table of Values
🟦 Concept
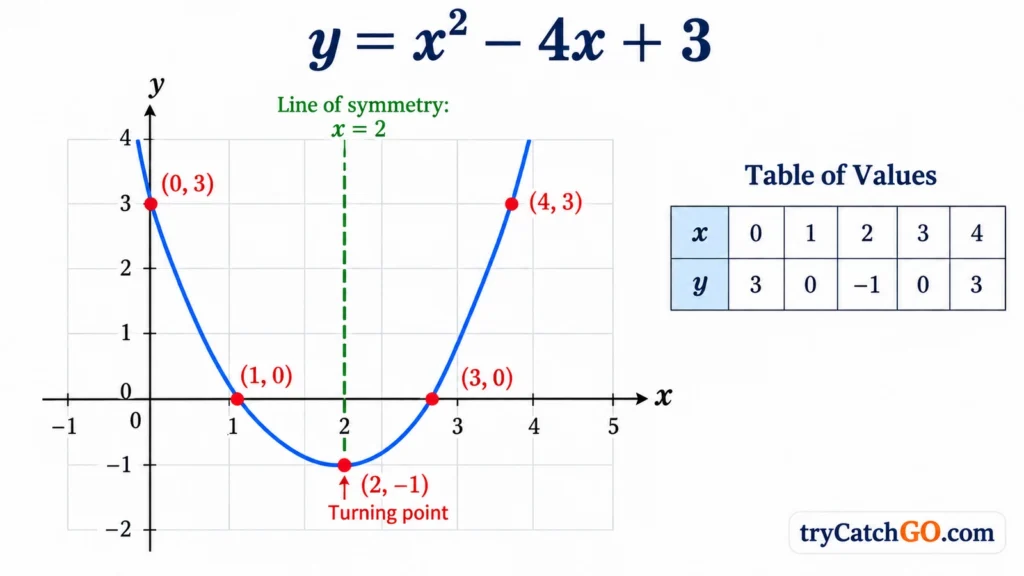
A quadratic graph can be drawn by calculating several coordinate points and plotting them on a coordinate grid.
For a quadratic equation:
choose suitable values of , calculate the corresponding values of , and record the results in a table of values.
Then plot the coordinates and join them with a smooth curve.
🟩 Example
Consider:
Choose these -values:
Now calculate for each value.
1. When
So the coordinate is:
2. When
So:
3. When
So:
4. When
So:
5. When
So:
🟪 Table of Values
| 0 | 1 | 2 | 3 | 4 | |
|---|---|---|---|---|---|
| 3 | 0 | −1 | 0 | 3 |
Therefore, the points to plot are:
🟨 Plot the Points
Plot each coordinate accurately on the graph.
Notice that:
have the same -value.
Also:
have the same -value.
This happens because the quadratic graph is symmetrical.
The middle point is:
which is the turning point.
The line of symmetry is:
🟧 Draw the Curve
After plotting the points, join them using a smooth curved line.
Do not join the coordinates using straight line segments.
For this example, the finished graph opens upwards because:
The key features are:
💡 Exam Tip
Choose enough -values on both sides of the turning point.
This helps you draw the parabola accurately and makes its symmetry easier to see.
If the question already provides a table, carefully calculate any missing y-values before plotting the graph.
⚠️ Common Mistake
Do not draw:
point → straight line → point → straight line
A quadratic graph is a smooth curve.
Also, make sure you:
- use the correct scale;
- plot each coordinate accurately;
- label both axes;
- draw a thin, smooth curve through the plotted points.
⭐ Quick Summary
To plot a quadratic graph using a table of values:
Choose x-values
↓
Substitute each xx-value into the equation
↓
Calculate the corresponding y-values
↓
Write the coordinates in a table
↓
Plot the coordinates
↓
Join them with a smooth quadratic curve
For:
the table gives:
These points form a smooth upward-opening parabola.