
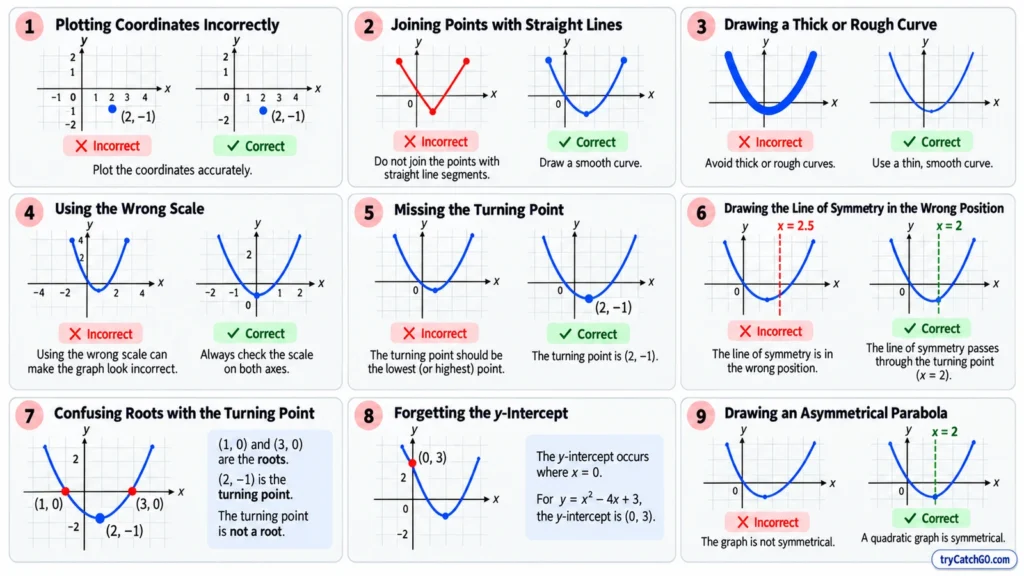
Common Mistakes When Drawing Quadratic Graphs
Drawing a quadratic graph is not difficult, but small plotting errors can make the whole parabola inaccurate. Here are the most common mistakes to avoid.
⚠️ 1. Plotting Coordinates Incorrectly
After calculating a table of values, each point must be plotted accurately.
For example:
means:
A small plotting error can change the position of the turning point and the shape of the curve.
⚠️ 2. Joining the Points with Straight Lines
A quadratic graph is a smooth curve, not a collection of straight line segments.
❌ Incorrect:
Point → straight line → point → straight line
✅ Correct:
Draw one smooth parabola passing through the plotted points.
⚠️ 3. Drawing a Thick or Rough Curve
Avoid repeatedly tracing over the graph.
The curve should be:
- thin
- smooth
- continuous
- accurately drawn through the plotted points
A thick curve can make values difficult to read accurately.
⚠️ 4. Using the Wrong Scale
Always check the scale on both axes before plotting.
For example, one square might represent:
or:
or another value.
Do not automatically assume every square represents one unit.
⚠️ 5. Missing the Turning Point
The turning point is the lowest or highest point of the parabola.
For:
the turning point is:
The curve should turn smoothly at this point.
⚠️ 6. Drawing the Line of Symmetry in the Wrong Position
The line of symmetry passes directly through the turning point.
If the turning point is:
then the line of symmetry is:
It must be drawn vertically through , not or another nearby value.
⚠️ 7. Confusing Roots with the Turning Point
The roots are where the quadratic curve meets the x-axis.
At a root:
For:
the roots are:
and:
The turning point:
is not a root.
⚠️ 8. Forgetting the y-Intercept
The y-intercept occurs where:
For:
the y-intercept is:
For:
the y-intercept is:
⚠️ 9. Drawing an Asymmetrical Parabola
A quadratic parabola is symmetrical about its line of symmetry.
For example, if:
is the line of symmetry, points the same distance from should have the same y-value.
For:
we have:
and:
This symmetry is a useful way to check your graph.
💡 Exam Tip
Before finishing your graph, quickly check:
Scale → Points → Smooth curve → Roots → Turning point → Symmetry → Axis labels
If these are correct, your quadratic graph is likely to be accurate.
⭐ Quick Summary
A good quadratic graph should have accurately plotted coordinates, a thin smooth curve, the correct scale, proper symmetry, and clearly labelled axes.
Most importantly:
Never join quadratic points using straight line segments.
[the-post-grid id=”4064″ title=”Luban Post GRID”]