
18.4 Range of a Quadratic Graph
The range of a quadratic graph is the set of all possible y-values that the graph can take.
For a quadratic functionthe range depends mainly on the turning point and whether the parabola opens upwards or downwards.
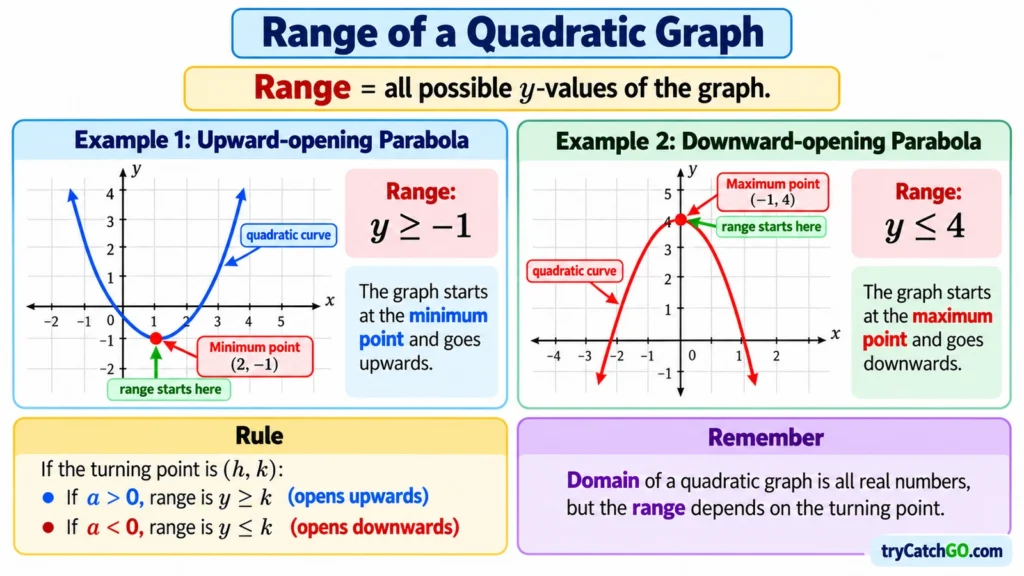
Look at the reference diagram above. The two graphs show the two possible situations:opens upwards and has a minimum value, whileopens downwards and has a maximum value.
Concept
The range tells us all the possible outputs of a function.
Since the output values are shown on the vertical -axis,
This is different from the domain.
For a quadratic graph, the most important point for finding the range is the turning point.
If the parabola opens upwards, the turning point gives the minimum y-value.
If the parabola opens downwards, the turning point gives the maximum y-value.
Formula
A quadratic function has the general formwhereThe -coordinate of the turning point can be found usingSubstitute this value of into the quadratic equation to find the corresponding -coordinate.
Suppose the turning point isIfthe parabola opens upwards, so is the minimum value.
Therefore,Ifthe parabola opens downwards, so is the maximum value.
Therefore,So remember:
Example Math — Opens Upwards
Look at the left-hand graph in the reference diagram.
The equation is
We want to find its range.
Step 1: Determine the direction
Comparing withwe haveSincethe parabola opens upwards.
Therefore, the graph has a minimum turning point.
Step 2: Find the -coordinate of the turning point
Use
Here,andsoThe axis of symmetry is thereforewhich agrees with the reference graph.
Step 3: Find the -coordinate
SubstituteintogivingSo the turning point isand the minimum value of is
Step 4: State the range
Because the graph opens upwards, it can take and every value greater than .
Therefore,So the range isThis agrees with the left-hand graph in the reference image.
Example Math — Opens Downwards
Now look at the right-hand graph.
The equation isHere,Sincethe parabola opens downwards.
Therefore, its turning point gives the maximum value.
From the reference graph, the turning point isSo the greatest possible value of isTherefore,Hence,The graph can take values such asbut it can never go aboveA+ Insight — Why the Turning Point Determines the Range
An A+ student should understand why, not simply memorize the inequality.
Consider
Complete the square:For every real value of ,Therefore,which meansSo is mathematically the smallest possible value of .
That is exactly what we see at the turning pointin the graph.
A+ Insight — The Downward Case
Forwe knowTherefore,Adding givessoAgain, the algebra agrees perfectly with the graph.
The maximum occurs whengiving the turning point
Completed Square Form and Range
The completed square form of a quadratic isThe turning point isThis makes the range much easier to recognize.
For example,has turning pointand opens upwards.
Therefore,Now considerThe turning point isand the parabola opens downwards.
Therefore,For many quadratic questions, completed square form is the fastest way to identify the range.
Domain vs Range
It is important not to confuse these two ideas.
For the left-hand graph,the graph continues indefinitely to the left and right.
Therefore, its domain isBut the graph never goes belowso its range isFor the right-hand graph,the domain is againbut the graph never goes above .
Therefore,A useful memory rule is:Exam Tip
When an exam asks you to find the range of a quadratic graph, first locate the turning point.
Use its y-coordinate, not its -coordinate.
Then look at the direction of the parabola.
If it opens upwards,If it opens downwards,For example, if the turning point isand the graph opens upwards, the range isnot
Common Mistake
A very common mistake is using the xx-coordinate of the turning point to write the range.
For the graph
the turning point isThe range is notbecause is the -coordinate.
The relevant value is the -coordinate:Therefore,Another common mistake is reversing the inequality.
An upward-opening graph has a minimum, so its -values are greater than or equal to that minimum.
A downward-opening graph has a maximum, so its -values are less than or equal to that maximum.
❓ Question Answer
Q1. What is the range of a quadratic graph?
The range is the set of all possible -values produced by the quadratic function.
Q2. Which coordinate of the turning point determines the range?
The y-coordinate.
Q3. What happens when a>0a>0?
The parabola opens upwards and has a minimum value.
Q4. What happens when a<0a<0?
The parabola opens downwards and has a maximum value.
Q5. What is the range ofThe turning point issoQ6. What is the range ofThe turning point issoQ7. Do the roots determine the range?
No. The roots show whereThe turning point determines the maximum or minimum value and therefore the range.
Quick Summary
The range of a quadratic graph is the set of possibleFor a quadraticfind the turning point.
If the turning point isthen:andFrom the reference diagram:has turning pointsowhilehas turning pointsoThe key idea is:and the y-coordinate of that turning point gives the boundary of the range.
🔗 Want to know more?
Continue with Domain of a Quadratic Graph, Turning Point, Axis of Symmetry, Maximum and Minimum Values, Completing the Square, and Solving Quadratic Equations Graphically.