
19.2 How to Draw a Quadratic Graph?
A quadratic graph may look complicated at first, but it becomes much easier when you follow a clear method.
The basic process is:
Make a table → Calculate the values → Plot the points → Draw a smooth curve
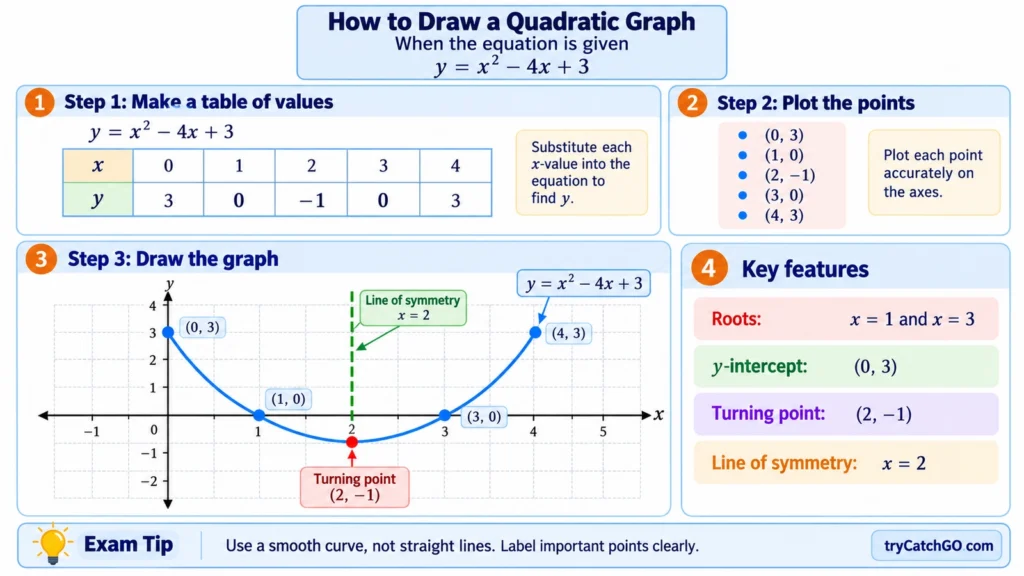
🔵 Concept
A quadratic graph is the graph of a quadratic function.
A quadratic function is usually written in the form:
where:
The graph of a quadratic function is called a parabola.
A parabola can open either upwards or downwards.
If:
the parabola opens upwards.
If:
the parabola opens downwards.
For example:
opens upwards, while:
opens downwards.
🟢 Key Idea
To draw a quadratic graph, we need to find several coordinates that lie on the curve.
Suppose the quadratic function is:
Choose a value of , substitute it into the function, and calculate the corresponding value of .
The two values form a coordinate:
Repeat this process for several values of .
Once you have enough coordinates, plot them on the graph and draw a smooth curve through them.
🟣 Example 1: Drawing a Quadratic Graph
Draw the graph of:
for:
🟨 Step 1: Make a Table of Values
We are given:
Therefore, we can use the integer values:
Start by making a table.
| ? | ? | ? | ? | ? | ? | ? |
We calculate each missing value using:
🟨 Step 2: Calculate the Values of
When
Substitute :
So the coordinate is:
When
So the coordinate is:
When
So the coordinate is:
When
So the coordinate is:
When
So the coordinate is:
When
So the coordinate is:
When
So the coordinate is:
🟨 Step 3: Complete the Table
The completed table is:
Therefore, the coordinates are:
🟨 Step 4: Choose a Suitable Scale
Before plotting the points, look at the values that need to fit on the graph.
For the -axis:
For the -axis:
For this example, a convenient scale could be:
x-axis: 1 large square = 1 unit
y-axis: 1 large square = 1 unit
Always check the scale carefully before plotting.
Do not assume that every square represents unit.
🟨 Step 5: Plot the Coordinates
Plot each of the following points:
Remember that a coordinate is written as:
The -coordinate tells you how far to move horizontally.
The -coordinate tells you how far to move vertically.
For example, for:
move horizontally to:
and then vertically down to:
🟨 Step 6: Draw a Smooth Curve
Once all the points have been plotted, draw one smooth curve through them.
Do not join the points with separate straight lines.
A quadratic graph is a smooth parabola.
For our example:
the coefficient of is positive:
Therefore:
so the parabola opens upwards.
🟢 What Can We Read From the Graph?
Once the graph has been drawn, we can identify several important features.
1. Roots or x-Intercepts
The roots are where the graph meets the -axis.
At the -axis:
For our graph, this happens when:
and:
Therefore, the roots are:
These are also the solutions of:
2. Turning Point
The lowest point of the graph is:
This is the turning point.
Since the parabola opens upwards, it is also the minimum point.
3. Line of Symmetry
A quadratic graph is symmetrical about a vertical line through its turning point.
Since the turning point is:
the line of symmetry is:
The line of symmetry is also commonly called the axis of symmetry.
Notice that:
and:
The points on opposite sides of the line of symmetry have matching -values.
4. y-Intercept
The -intercept is where the graph crosses the -axis.
At the -axis:
Substitute :
Therefore, the -intercept is:
🟠 Exam Tip
In an exam, Cambridge may provide a table with some values already completed and ask you to calculate the missing values.
Complete the table before drawing the graph.
One incorrect value can cause a point to be plotted in the wrong place and affect the shape of the parabola.
🟠 Exam Tip: Use Symmetry to Check Your Values
A quadratic graph is symmetrical.
For our example:
and:
If values that should match are different, check your calculations.
This is a quick way to detect an error.
🟠 Exam Tip: Check the Scale
Never assume that every square represents unit.
For example, an axis may be labelled:
or:
Always check the scale on both axes before plotting the points.
🔴 Common Mistake: Negative Numbers
Be careful when substituting negative values.
Suppose:
in:
Substitute using brackets:
Since:
we have:
Remember the important difference:
but:
Using brackets around negative numbers helps prevent sign errors.
🔴 Common Mistake: Joining the Points With Straight Lines
Do not use a ruler to join each plotted point to the next.
A quadratic graph should be a smooth continuous curve.
The points guide the shape of the parabola.
🔴 Common Mistake: Drawing a Thick Curve
Avoid repeatedly drawing over the same line.
A thick or fuzzy curve makes it difficult to read accurate values from the graph.
This can cause problems when finding:
- roots,
- turning points,
- intersections,
- coordinates.
Use a sharp pencil and draw a thin, smooth curve.
🧠 Easy Method to Remember
Remember these five steps:
TABLE → CALCULATE → PLOT → CHECK → CURVE
TABLE — Write the required -values.
CALCULATE — Substitute each -value to find .
PLOT — Plot each coordinate .
CHECK — Check the scale and your plotted points.
CURVE — Draw one smooth parabola.
❓ Question & Answer
Q1. What is a quadratic graph called?
A quadratic graph is called a parabola.
Q2. What is the general form of a quadratic function?
where:
Q3. How do I know whether the parabola opens upwards or downwards?
Look at the coefficient .
If:
the parabola opens upwards.
If:
the parabola opens downwards.
Q4. Should I use a ruler to join the plotted points?
No. Draw a smooth curve through the points.
Q5. What is the turning point?
The turning point is where the parabola changes direction.
An upward-opening parabola has a minimum turning point, while a downward-opening parabola has a maximum turning point.
Q6. What are the roots of a quadratic graph?
The roots are the -values where the graph meets the -axis.
At the roots:
Q7. Does every quadratic graph have two roots?
No. A quadratic graph may cross the -axis twice, touch it once, or not meet it at all.
Q8. Why should I use brackets when substituting negative numbers?
Because:
but:
Using brackets helps prevent sign errors.
✅ Final Check
Before finishing your quadratic graph, check:
- Have I completed the table correctly?
- Have I substituted negative numbers using brackets?
- Have I checked the scale on both axes?
- Have I plotted every coordinate accurately?
- Have I used first and second?
- Have I drawn one smooth curve?
- Is my curve thin and clear?
- Have I avoided joining the points with straight lines?
If all of these are correct, your quadratic graph is complete.